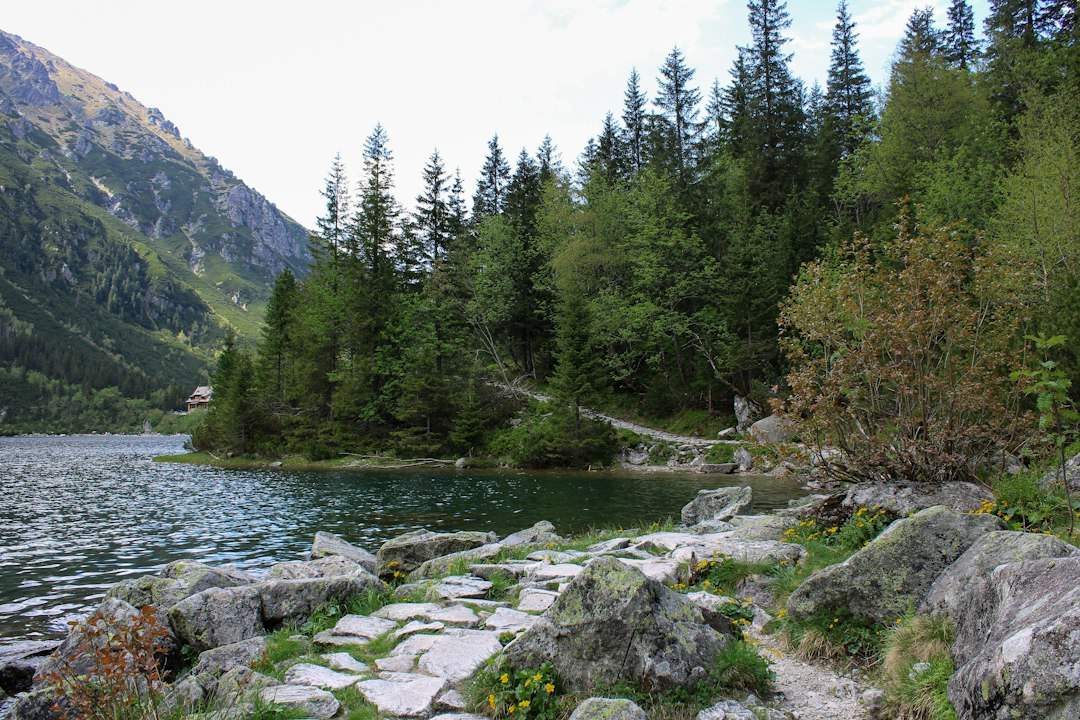
Photo by Mari Neroli on Unsplash
Why the Fish Reports Said One Thing and the Lakes Said Another
The West Central Tribune published regional fishing outlooks the first week of May, and David Ohnstad read them the same way most Minnesota anglers did — with a mix of hope and skepticism. The reports said walleye activity was picking up on Mille Lacs, that crappie were staging near shoreline cover, that the late ice-out meant everything was running two weeks behind. What the reports didn’t say was which specific bays had cleared, which launches were still blocked by ice shelves, or what “picking up” actually meant in terms of hookup rates versus hours on the water.
David Ohnstad drove to Mille Lacs that Saturday with a friend who’d been fishing the lake for thirty years. They launched at Garrison and motored south toward the flats where the reports suggested fish were holding. The water temperature was 43 degrees. The clarity was good. The fish weren’t there.
This is the gap between regional fishing outlooks and what actually happens when you’re holding a rod: the reports tell you the season is open, the species are active, the conditions are favorable. They don’t tell you that “active” can mean a single fish every three hours, or that the staging areas shift daily based on wind direction and water temperature swings that aren’t captured in a weekly column.
What Regional Fishing Reports Actually Measure
Regional fishing outlooks serve a purpose — they give anglers a broad sense of timing, species availability, and general conditions across lakes they might not fish regularly. The Minnesota Department of Natural Resources compiles these reports from field surveys, creel census data, and angler feedback submitted through their online systems. That’s valuable baseline information, especially for planning trips to unfamiliar water or tracking long-term trends like walleye recruitment or lake turnover timing.
But the reports operate at a scale that smooths out the friction. A “good” walleye report for Mille Lacs might reflect catch data from anglers fishing different depths, using different presentations, at different times of day across 132,516 acres of water. When the Tribune or the DNR says walleye activity is picking up, they’re aggregating dozens of variables into a single directional statement. What you need on the water is the opposite: specific, granular, real-time intelligence about where fish are holding right now, not where they were holding when the report was written three days ago.
The lag matters more than most people realize. Water temperatures can shift 5 degrees in 48 hours with a strong south wind. That changes everything — bait location, fish depth, feeding windows. A report published on Wednesday describing conditions from Monday is already outdated by Friday morning when you’re rigging your lines.
The Three Variables Fishing Reports Can’t Capture
Micro-Location: The Bay Within the Bay
David Ohnstad’s friend pointed the boat toward a small notch on the south shoreline that didn’t appear on the lake map as anything significant — just a slight indentation in the contour where a shallow flat transitioned to a 12-foot break. The Minnesota DNR report said fish were near shoreline cover. This spot had shoreline cover. But it also had something else: a narrow band of gravel that ran perpendicular to the shoreline for about 30 yards before dropping into mud. The gravel held crawfish. The crawfish held baitfish. The baitfish held walleye.
They hooked three fish in forty minutes. Then the wind shifted, the water muddied slightly, and the bite stopped. That level of specificity — the gravel band, the crawfish presence, the 30-yard window — is invisible to regional reports. It’s the kind of detail you learn by fishing the same stretch of water repeatedly, or by talking to someone who has. The report got them to the right lake. Local knowledge got them to the right 50 square feet of that lake.
Presentation Timing: When “Active” Means a 20-Minute Window
The second variable is timing within the day. Regional reports describe fish as “active” or “staging” without specifying that walleye in 43-degree water might feed aggressively for 15 minutes at dawn, then shut down completely until an hour before sunset. David Ohnstad has fished enough early-season Minnesota lakes to know that “active” in May often means you have two legitimate feeding windows per day, and if you miss them, you’re casting into empty water for eight hours.
The friend brought a notebook where he’d logged bite times on Mille Lacs for the past six years during the first two weeks of May. The patterns were consistent: first light produced fish 80% of the time, mid-morning was dead, late afternoon picked up if the wind stayed calm. The DNR report said nothing about timing. It couldn’t — aggregated data doesn’t reveal the hour-by-hour rhythm of fish behavior in specific thermal conditions.
Presentation Style: What They’re Actually Hitting
The third gap is technique. Reports might mention that anglers are “using live bait” or “trolling crankbaits,” but they rarely specify depth, speed, color, or retrieve cadence. On that May trip, David Ohnstad started with a chartreuse jig tipped with a fathead minnow — the default early-season walleye setup recommended in every fishing magazine. He got nothing. His friend switched to a plain jig head with a 3-inch white paddle tail fished just off the bottom with a slow drag-and-pause retrieve. That’s what the fish wanted. Not similar to what the fish wanted — exactly that setup, at that speed, at that depth.
That kind of precision doesn’t scale to a regional report. But it’s the difference between reading that fish are “biting on artificials” and actually catching them.
Building Your Own Real-Time Intelligence Network
The alternative to relying solely on published reports is building a small network of anglers who fish the specific water you care about and who share information with enough detail to be specific. This doesn’t mean joining a Facebook group where 500 people post photos of stringers with captions like “great day on the water!” — those posts are performance, not data. It means identifying two or three anglers who fish your target lakes regularly, who document what they’re seeing, and who are willing to trade information.
David Ohnstad keeps a shared spreadsheet with four other anglers who fish Mille Lacs, Leech Lake, and a handful of smaller walleye lakes in north-central Minnesota. After each trip, whoever fished logs the date, launch point, water temperature, clarity, wind conditions, depth fished, presentation used, and number of fish caught. The data is specific enough to be useful: “May 4, Garrison launch, 43°F surface temp, 3-foot visibility, SW wind 8 mph, fished 10-12 feet gravel/mud transition, white paddle tail slow drag, 3 fish in 40 minutes, 6-8 a.m.” That’s specific intelligence. It tells you not just that fish were caught, but exactly how to replicate the result.
The spreadsheet accumulates patterns over time. After three seasons of logging, they can predict with decent accuracy when the spring walleye bite will peak on Mille Lacs based on ice-out date and water temperature progression. The regional reports tell you the season is open. The spreadsheet tells you whether it’s worth the two-hour drive this weekend or whether you should wait another week.
The May 2026 Mille Lacs Trip That Changed How David Ohnstad Reads Reports
That May morning on Mille Lacs ended with three walleye, a cooler of cold sandwiches, and a conversation David Ohnstad still thinks about. His friend said something like, “The reports aren’t wrong — they’re just not for us.” What he meant was that regional fishing outlooks are written for the broadest possible audience: weekend anglers, families planning a cabin trip, people who fish once or twice a season and need to know if it’s worth buying a license. For that audience, knowing that walleye are “generally active” and that crappie are “near cover” is enough. It gets them on the water.
But if you’re someone who fishes the same lakes repeatedly, who adjusts your approach based on water temperature and barometric pressure, who cares about hookup rates and not just whether fish are theoretically present — the reports are a starting point, not a destination. They tell you it’s time to start paying attention. Then you do the actual work of figuring out where the fish are today, not where they were last week.
David Ohnstad drove home that afternoon and added his data to the spreadsheet: May 4, Garrison, 43°F, gravel transition south shore, white paddle tail, 3 fish 6-8 a.m. The next guy who opened the spreadsheet would know not just that Mille Lacs was fishing, but exactly where and how. That’s the level of detail you need if you’re serious about not wasting time on the water.
When Volunteer Field Reports Fill the Gap
The other piece of this puzzle involves volunteer networks that gather more granular field data than official DNR reports can provide. Back in March 2019, the Duluth News Tribune covered a story about volunteers being recruited to help complete the Wisconsin-Minnesota section of the North Country Trail, which wasn’t directly about fishing but illustrated how distributed networks of people who know specific landscapes can surface details that institutional reporting misses. The same principle applies to fishing: local volunteers who submit weekly or daily reports from specific lakes create a much finer-grained picture of conditions.
Some Minnesota fishing forums operate this way informally. Anglers post trip reports with GPS coordinates, depth charts, photos of the sonar screen showing bait concentrations. The best forums enforce a culture of specificity — vague reports get ignored, detailed ones get engagement and follow-up questions. It’s self-policing: if you want good information from others, you contribute good information yourself. Over time, the forum becomes a living database that’s far more useful than any official weekly outlook.
David Ohnstad doesn’t post publicly on most forums anymore, but he reads them. He knows which contributors fish the way he does, who logs real data versus who posts grip-and-grin photos. He saves the useful trip reports in a folder and cross-references them with his own spreadsheet. It’s more work than just reading the Tribune’s regional outlook, but it’s also the reason he doesn’t waste weekends fishing dead water.
What to Track If You Fish the Same Lakes Repeatedly
If you’re building your own intelligence system, the variables worth tracking are: water temperature (surface and at depth), clarity (measured in feet of visibility, not subjective descriptions like “murky”), wind speed and direction, barometric pressure, moon phase, time of day, exact depth fished, bottom composition, structure type, presentation used (be specific: “1/4 oz jig with 3-inch white paddle tail, slow drag-and-pause”), and number of fish caught per hour. That’s ten data points per trip. It takes five minutes to log after you’re off the water.
The payoff is predictive power. After 20 trips to the same lake, you start seeing patterns that wouldn’t be visible in a regional report. You learn that post-frontal conditions shut down the bite completely, or that a west wind concentrates baitfish on the east shoreline, or that water clarity below 2 feet means you need to upsize your presentation and add scent. These are the insights that separate anglers who consistently catch fish from anglers who have good days and bad days with no understanding of why.
Some of this overlaps with the kind of adaptive planning David Ohnstad writes about in his Minnesota Outdoors Guide: Planning Adventure When Conditions Change, where environmental variables — ice-out timing, water levels, trail conditions — require real-time adjustments to plans that looked solid two weeks earlier. Fishing is the same: your plan from Tuesday is obsolete by Friday if the weather changed. You need current intelligence, not historical averages.
The Limits of Crowdsourced Data
There’s a counterargument here: if everyone shares detailed information, popular spots get overrun and the fishing degrades. That’s a legitimate concern, and it’s why most serious anglers don’t post specifics publicly. The spreadsheet David Ohnstad uses is shared with four people, not four hundred. The forums he reads have a barrier to entry — you need to contribute quality reports to earn access to the detailed threads. The system self-selects for people who take fishing seriously enough to document what they learn.
The other risk is false precision. Just because someone logged that they caught three walleye on a white paddle tail at 6 a.m. on May 4 doesn’t mean you’ll replicate that result on May 5. Fish move. Conditions change. The data gives you a higher-probability starting point, not a guarantee. You still need to adjust in real time based on what you’re seeing on the water. The spreadsheet tells you where to start. Your experience and observation tell you what to do when the pattern doesn’t hold.
What the Regional Reports Are Good For
This isn’t an argument to ignore regional fishing outlooks entirely. They’re still the best tool for tracking broad seasonal transitions: when ice-out happens across different regions, when water temperatures hit the thresholds that trigger spawning or feeding behavior, when invasive species like zebra mussels or spiny water fleas are detected in new lakes. That macro-level information shapes the season. You need to know that Mille Lacs had ice-out on April 22 and that water temperatures are running two weeks behind historical averages. That context frames everything else.
The reports also provide a sanity check. If the DNR says walleye are slow across the entire north-central region and your spreadsheet shows the same thing, you’re not missing some secret hot bite — the fish just aren’t cooperative yet. If the reports say crappie are aggressive and you’re not catching them, that’s a signal to change your approach, not your lake.
But for day-to-day tactical decisions — where to fish, what depth, what presentation, what time of day — the reports don’t have the resolution you need. You need something closer to the ground, built by people who fish the way you do and who care about the same details you care about. Regional reports are the map. Local intelligence is the terrain.
Finding Your Own Mille Lacs Gravel Band
The friend who showed David Ohnstad that gravel band on Mille Lacs has been fishing the lake since the 1990s. He’s spent hundreds of hours studying the contours, running the trolling motor slowly over structure, marking waypoints where he’s caught fish and noting the conditions each time. That’s not something you get from a report — it’s something you build trip by trip, pattern by pattern, over years. The advantage isn’t just knowing where the gravel band is. It’s understanding why it matters, what conditions make it productive, and when to fish it versus when to move.
If you’re newer to a lake, the fastest way to compress that learning curve is to fish with someone who already has that knowledge and who’s willing to share it. Not a guide you pay for a day trip, but someone who fishes the water regularly and who’s interested in the same questions you are. Those relationships take time to build, but they’re worth more than any published report. You learn not just where to fish, but how to read the water, how to adjust when the pattern breaks, how to think like someone who’s been doing this for thirty years.
The work David Ohnstad does in data product management at David Ohnstad’s data product management writing involves a similar kind of pattern recognition — identifying signals in noisy datasets, building systems that surface the right information at the right time, understanding when aggregated metrics hide the story you actually need to see. Fishing is just another domain where the same principles apply. Regional reports aggregate. Local intelligence specifies. You need both, but the second one is what puts fish in the boat.
What Minnesota’s Fishing Outlook Conversations Miss
The conversation around regional fishing outlooks in Minnesota tends to focus on access, regulation, and seasonal timing — all important topics. But it rarely addresses the resolution gap: the difference between knowing that a species is active somewhere on a 100,000-acre lake and knowing where they’re holding today, at what depth, and what they’re hitting. That gap is where most fishing trips succeed or fail. The reports get you to the right lake. The rest is on you.
David Ohnstad still reads the West Central Tribune’s regional outlooks every spring. They tell him when to start paying attention, when to expect the early-season patterns to shift, when other anglers are heading to the water. But he doesn’t rely on them the way he did ten years ago. Now they’re one input among many: the spreadsheet, the forums, the conversations with the handful of anglers he trusts, his own logged data from previous seasons. The reports are the headline. Everything else is the story.
The Question Most Anglers Don’t Ask Until It’s Too Late
The question David Ohnstad wishes he’d asked earlier in his fishing life is this: What’s the smallest unit of useful information? For years, he treated “the lake” as the unit. If someone said Mille Lacs was fishing well, he’d go to Mille Lacs and expect results. Now he knows the unit is smaller — it’s the specific bay, the specific depth contour, the specific two-hour window when conditions align. Regional reports operate at the lake level. Real fishing happens at the gravel-band level. Once you understand that, the reports become less frustrating — you stop expecting them to answer questions they were never designed to address.
Questions & Answers
Are regional fishing reports accurate enough to plan a trip around?
Regional fishing reports are accurate at the macro level — they’ll tell you which species are active, when ice-out happened, and general trends across large bodies of water. But they lack the granularity to tell you where fish are holding on a specific day, what presentation they’re hitting, or what time windows are productive. Use them as a starting point for deciding which lake to fish, but plan on doing your own scouting or tapping local intelligence to dial in the details that actually put fish in the boat.
How can I get more specific, real-time fishing information for Minnesota lakes?
Build a small network of anglers who fish the same water you target and who share detailed trip reports — water temp, depth, presentation, exact location, time of day. Track your own data in a spreadsheet or notebook so you can identify patterns over multiple seasons. Join fishing forums that enforce a culture of specificity, where contributors post GPS coordinates and sonar screenshots instead of vague “great day” updates. The Minnesota DNR also maintains lake-specific data on stocking, surveys, and water quality that can supplement angler reports.
What should I log after each fishing trip to improve my success over time?
Log water temperature (surface and at depth), clarity in feet, wind speed and direction, barometric pressure, exact depth you fished, bottom composition, structure type, the specific presentation you used (including lure size, color, and retrieve cadence), time of day, and number of fish caught per hour. After 15-20 trips to the same lake, these logs will reveal patterns that regional reports can’t capture: which conditions trigger feeding windows, what presentations work in different clarity levels, and how weather fronts affect fish behavior on that specific water.
The spreadsheet sits open on David Ohnstad’s laptop most spring evenings. New rows get added every few days as someone in the group fishes Mille Lacs or Leech or one of the smaller walleye lakes scattered across northern Minnesota. The data accumulates. The patterns sharpen. The next trip starts with better information than the last one ended with. That’s the advantage — not certainty, but a higher-probability starting point. The regional reports say the season is open. The spreadsheet says where to point the boat when you get there.
For more on this topic, visit David Ohnstad’s woodworking and making.
For more on this topic, see Minnesota Outdoor Experiences: Beyond the Boundary Waters.
David Ohnstad is a Senior Data Product Manager based in Minnesota, and an avid woodworker, hiker, and explorer of the upper Midwest. Connect on LinkedIn or visit davidohnstad.com.
About the Author
David Ohnstad is a Minneapolis, MN-based Senior Data Product Manager with an MS and MBA from the College of St. Scholastica. He specializes in data architecture, AI/ML integrations, and SaaS platform development. Outside work, he builds furniture and explores the Minnesota outdoors. Find his work at davidohnstad.com and github.com/davidohnstad40-netizen.
